Dissecting the intersection of
Economics, Geopolitics & Financial Markets


As the World Cup moves to the 16 knockout stage, do economic data provide any clues as to who could win? The simple answer is no. A quick look at some of the stats & anecdotes.
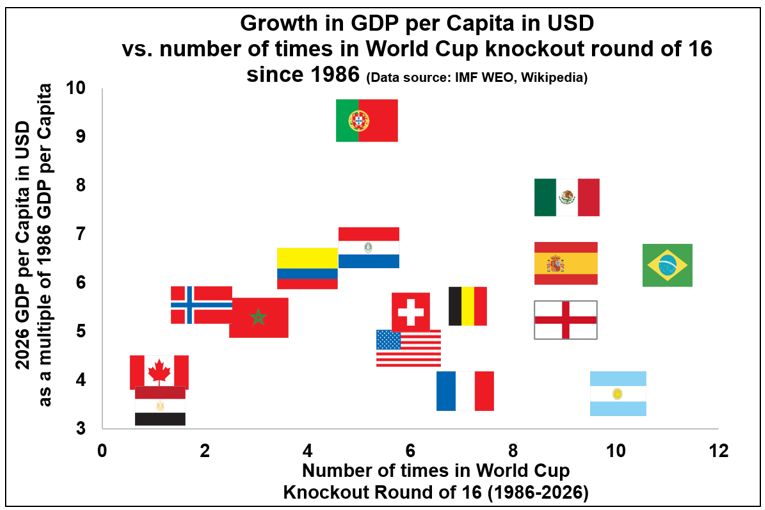
- The chart below shows no clear correlation between growth in GDP per capita (in USD) and reaching the 16 knockout round since 1986
- Indeed, Argentina’s GDP/Capita has grown by a similar amount to Egypt’s & France’s but Argentina has been in the 16 knockout stage 10 times of 11 since 1986, vs 7 for FRA & 1 for EGY
- Spain, Brazil and Mexico possibly stand out as the countries combining an increase in GDP per capita with performance at the World Cup
- Brazil is the only country to have made it to the 16 knockout stage at every World Cup since 1986. Colombia has made it 4x (with similar GDP/Capita growth)
- Portugal has seen the biggest rise in GDP/Capita by far since 1986 but “only” made it 5 times to the 16 knockout stage since 1986
- If we removed Argentina and Portugal from the list, the R-squared value rises from 0.03 to 0.3 (without wanting to generate a sophisticated stats discussion here)
- Latam has 5 countries in the 16 knockout round this year, Africa has Egypt and Morocco, while Asia is no longer represented
- Looking forward to many more exciting games – Pls add any other observations below…