Dissecting the intersection of
Economics, Geopolitics & Financial Markets

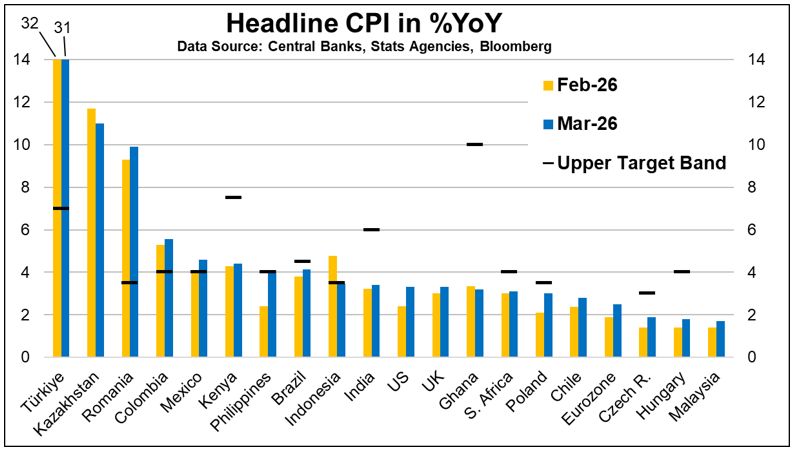
Sixteen of 20 countries in this chart saw YoY CPI rise in March, mainly on energy. Many Central Banks are in “wait-and-see” mode. The bigger concern for EM but also DM is pass-through into food prices.
Thoughts & comparisons to 2022:
1) From end-Jan to end-Mar, Brent Crude jumped 44% in 2026 vs. 17% in 2022
2) From end-Jan to end-Mar, the FAO food price index jumped 3.5% in 2026 vs. 18% in 2022
3) In 2026, the initial shock is energy (Hormuz=20% of global oil/derivs & LNG), with a slower pass-through than 2022 to food prices (a fuel & fertilizer shock now rather than grain supply shock)
4) In 2022, the shock was mainly grains & food oils (UA+RU were 30% of wheat & 20% of maize exports globally) and less of an energy shock (RU Oil+NatGas to the EU) than 2026.
5) A further closure of Hormuz drains global crude storage = rationing & likely demand destruction. Strategic storage is not the same everywhere. Airlines are already cutting daily flights.
6) FAO says: a) world cereal stocks likely at record 951.5 million tonnes, b) bulk of the 2026 global wheat crop is already in the ground, c) 2026 wheat output down 1.7%YoY but still above 5-year avg, d) Hormuz closure raises uncertainties.
7) So, the big questions for central banks are how long Hormuz is shut & how much of the rise in global food prices drives retail mark-ups and for how long? And of course – what does the Fed do?
8) As the chart shows, TR, RO, CO, MX, PH, ID are at or above the upper target band & need more hawkish CenBanks. Others like BZ & PL need to remain cautious, while African CenBanks are very exposed, given the large weight of food in their CPI baskets…